How AI Website Builders Help Recruiters Present Data-Driven Insights
Guest Contributor: Emily Ahearn
The recruitment process these days is no longer just about posting jobs and reviewing resumes. It has become a highly data-driven process. Hiring teams now rely on metrics to understand what is working and what needs improvement.
But how do recruiters present all that data in a way stakeholders understand? A majority of decision-makers will not want the data but rather insights.
Research indicates that 73% of talent acquisition professionals believe data analysis is essential for identifying and attracting qualified candidates.
This is where AI website builders are revolutionizing the game, and this article explains how they do so.
What Are AI Website Builders?
AI website builders are platforms that use artificial intelligence to automatically create websites, dashboards, and visual pages. This is done based on user input and connected data sources.
Here, you do not need to manually design layouts, write code, or build pages from scratch. Just simply describe what you want or connect your data tools, and then the AI generates the structure, design, and layout.
This is a great opportunity for recruiters. Instead of sharing spreadsheets or long presentations, recruiters can build live recruitment data hubs. They help visualize data in real-time.
For example, consider a hiring manager who wants to see hiring insights. You have already implemented this technology. Now, the hiring manager will just visit the web page and see insights that matter the most to them.
As these insights are presented in one place, it becomes much easier for teams to understand hiring performance. Such clarity ensures that AI website builders help recruiters achieve great results.
The Growing Importance of Data in Modern Recruitment
Recruitment used to rely heavily on intuition and experience. A recruiter might say, “This sourcing channel usually works,” or “It feels like hiring is taking longer this quarter.”
But modern organizations want evidence-oriented hiring decisions.
Recruiting teams track a lot of metrics. These insights help answer questions like:
- Which sourcing channels bring the best candidates?
- Where are candidates dropping out of the pipeline?
- How long does hiring really take?
- Are diversity goals being met?
However, collecting data is not the only thing for properly showing the results. Communication is the other important factor.
That is where visualization and presentation become vital.
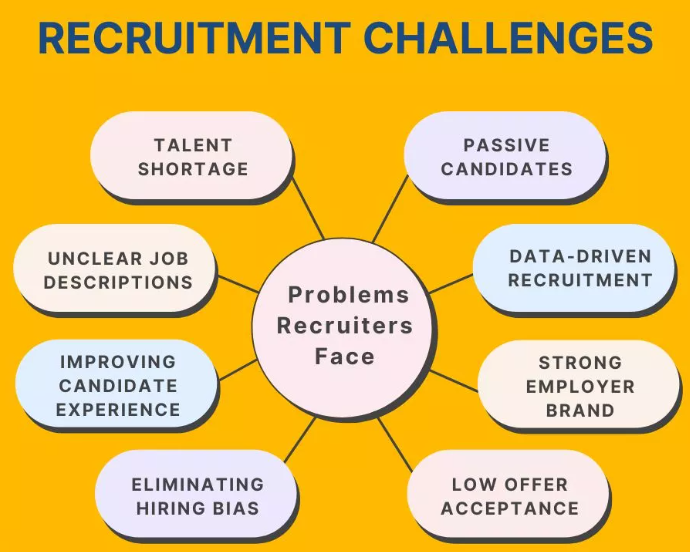
Why Recruiters Struggle to Present Recruitment Data Clearly
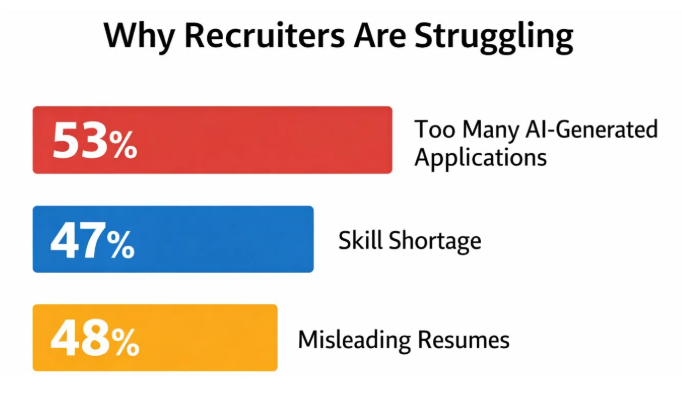
Many recruiters have access to data. But when it comes to presenting that information, they flounder.
Many recruiters face the following challenges while representing data clearly:
Too Many Spreadsheets
The recruitment data is scattered. It is stored in multiple tools and exports. Therefore, searching the data collected from ATS platforms, sourcing tools, and HR dashboards in spreadsheets is a time-consuming task. And this holds back recruiters from presenting results clearly and quickly.
Lack of Visualization Tools
Raw data doesn’t properly showcase the growth. Without charts or visual dashboards, hiring managers struggle to interpret trends. Recruiters can’t do this because they are not data analysts who’ll analyze data and create dashboards. They are even busy with many other things. Therefore, they struggle to present data clearly.
Time-Consuming Report Creation
Creating reports is a hectic task. It takes a lot of time and effort. And due to manual inputs, there might be cases where you miss a thing or two. This might negatively affect the decisions.
Data Fragmentation
Recruitment data comes from multiple systems, such as ATS platforms, sourcing tools, interview platforms, and HR systems. Bringing all of that together into one clear narrative is difficult.
AI website builders help solve these challenges by automating all aspects of recruitment data.
Key Recruitment Metrics That Require Clear Presentation
Now, let us understand which recruitment metrics benefit the most from clear visualization and structured presentation.
Time-to-Hire
Time-to-hire is the time required to hire a candidate from the initial application screening to finally accepting the offer letter. This helps you understand how efficient your hiring process is. It even throws light on which roles take longer to get hired so that you can tweak your process accordingly.
When your recruiters see these metrics in the trend chart or timelines, it's easier for them to identify patterns.
For example, you might find that some departments are taking more time to hire candidates. So, now your focus will be on finding the reasons why this is happening. Then, accordingly, you can improve your hiring process.
Cost-Per-Hire
Cost-per-hire means the total amount of investment that is made in hiring a new employee. The dashboards and reports will show you how much you are investing in talent acquisition.
This metric typically includes several cost components, such as:
- Job board posting fees
- Recruitment agency expenses
- Advertising and employer branding budgets
- Internal recruiter time and operational costs
Through proper visual dashboards and charts, recruiters can clearly see which hiring channels provide the best return on investment. With this data, you can make proper investment decisions.
Source-of-Hire Effectiveness
Source-of-hire is where successful hires originate. Understanding which channels produce the best candidates helps recruiters focus their efforts on the most productive sources.
Common hiring sources include:
- Job boards
- Employee referrals
- Professional networks like LinkedIn
- Company career pages
- Recruitment agencies
Manually checking which channels produced the best results is time-consuming. Therefore, create visual charts. They can clearly show which channels help in hiring the highest number of successful candidates. Accordingly, recruiters can optimize their strategies.
Candidate Pipeline Conversion Rates
There are multiple stages that candidates move through during a hiring process. These stages typically include:
- Application submission
- Initial screening
- Interview rounds
- Job offer stage
- Final hiring decision
Conversion rate metrics help recruiters understand how candidates progress through each stage of the pipeline. If a funnel chart is properly visualized, then recruiters can find where candidates are dropping out of the process.
Offer Acceptance Rate
The offer acceptance rate measures the number of candidates who accept job offers compared to those who receive them.
Recruiters can quickly identify changes and the reasons behind them if this metric is properly displayed in a visual format. A drop in acceptance rates may indicate issues such as:
- Uncompetitive compensation packages
- Poor candidate experience during interviews
- Delays in the hiring process
Visual dashboards help teams to easily identify the patterns.
How AI Website Builders Help Recruiters Present Data-Driven Insights
Now let’s explore how smart website builders transform recruitment data into actionable insights.
Transforming Recruitment Data into Visual Dashboards
AI website builders can automatically convert recruitment data into visual dashboards.
Instead of reading spreadsheets, stakeholders can see:
- hiring trends
- funnel performance
- sourcing effectiveness
Visual dashboards make complex data easy to interpret within seconds.
This is helpful during the meetings where executives want quick insights rather than long explanations.
Automatically Generating Recruitment Reports
Another advantage of AI website builders is automated report generation.
Instead of manually adding new data in the monthly hiring reports, recruiters can create dashboards that update automatically as new data comes in.
By creating dashboards using AI website builders, you just have to send a link to the hiring manager, instead of a PDF report. The page updates itself whenever new candidates enter the pipeline. This reduces manual reporting work drastically.
Creating Interactive Hiring Portals for Stakeholders
Recruitment involves multiple stakeholders:
- hiring managers
- HR professionals
- executives
- department heads
AI website builders enable recruiters to create interactive recruitment portals. Each stakeholder can explore the hiring metrics that are relevant to them. This works because the metrics that matter differ for every person.
Integrating Data from Multiple Recruiting Platforms
Recruitment data often comes from different tools, such as:
- applicant tracking systems
- HRIS platforms
- sourcing platforms
- interview tools
AI website builders can integrate these data sources into one unified dashboard. This removes the need to manually combine multiple reports. As a result, recruiters get one centralized view of recruitment performance.
Visualizing Candidate Pipeline and Hiring Funnel
One of the most powerful use cases of AI website builders is visual funnel tracking.
Recruiters can create pages that show:
- candidates entering the pipeline
- progression across interview stages
- drop-off points
- offer outcomes
This helps identify the flaws in the process. For example, if most candidates drop after technical interviews, then recruiters and hiring managers can properly analyze the interview process.
Providing Real-Time Recruitment Analytics
Traditional recruitment reports do not update as the information updates. Due to this, when it's time to present the reports, they are already outdated.
Unlike this, AI website dashboards provide real-time analytics. This allows teams to monitor hiring performance continuously. Let us consider that your hiring slows down or pipeline conversion drops. In such situations, the teams can respond immediately.
Improving Communication With Hiring Managers and Leadership
The greatest advantage of AI-powered dashboards is the ability to communicate effectively. For instance, recruiters often face the challenge of explaining issues clearly.
Instead of saying, “Hiring is slowing down,” a recruiter can instead use a visual chart to point out the exact stage where the slowdown is occurring.
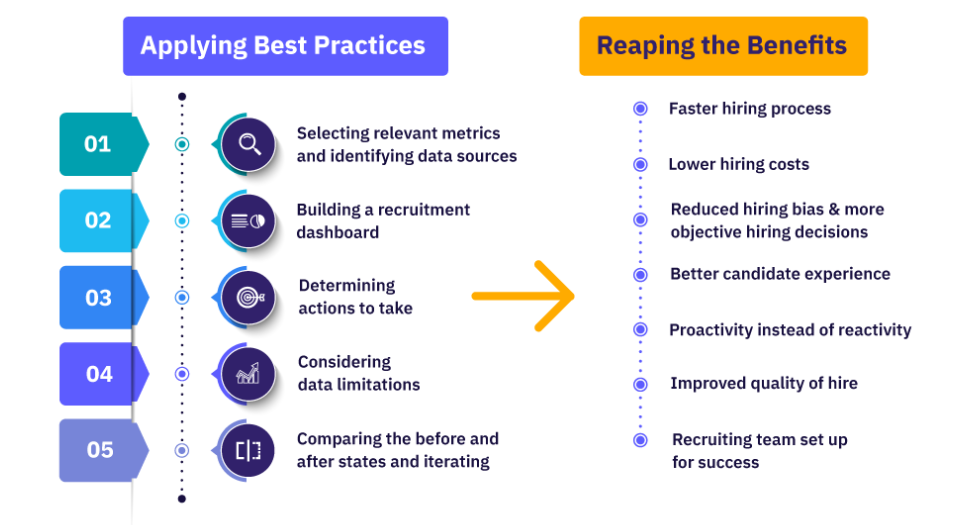
How Recruiters Can Use AI Website Builders to Present Data Insights

Next, let's take a look at a step-by-step guide you can follow when using no-code website builders to show the insights properly.
Step 1: Identify the Recruitment Metrics That Matter Most
Start by identifying the metrics leadership cares about.
These typically include:
- time-to-hire
- cost-per-hire
- pipeline conversion rates
- source-of-hire effectiveness
- offer acceptance rate
Avoid adding too many metrics because this may confuse the stakeholders. Just add the insights that create impact on hiring decisions.
Step 2: Collect and Organize Hiring Data from Recruitment Tools
In this step, you gather data from your recruitment platforms, such as:
- ATS systems
- HR platforms
- sourcing tools
- interview scheduling software
Ensure the data is properly organized and structured before visualization. If necessary, clean the data to get accurate insights.
Step 3: Use an AI Website Builder to Create a Data Dashboard
These days, a non-technical person can easily create dashboard pages with an AI website builder. With most platforms, users just need to describe what they want.
For example, if you type “help me create a recruitment dashboard that shows metrics like hiring funnel metrics and sourcing channel performance, with a proper color combination,” then the AI will automatically generate a structured layout according to your requirements.
Step 4: Turn Recruitment Data Into Visual Charts and Graphs
The next step is to convert the metrics into visual formats such as:
- funnel charts
- trend graphs
- bar charts
- comparison tables
Visualizing the data helps stakeholders understand insights properly.
Step 5: Build Interactive Pages for Hiring Managers and Stakeholders
Instead of designing a report consisting of just a single page, create separate sections for:
- department hiring dashboards
- sourcing analytics
- diversity metrics
- hiring pipeline updates
This gives the freedom to stakeholders to explore the required insights themselves.
Step 6: Conduct Real-Time Updates for Recruitment Metrics
To keep the dashboard updated with the latest recruitment metrics, connect it to the recruitment data sources. The stakeholders will always be able to view the latest recruitment performance.
Step 7: Share the Recruitment Insights With the Teams
The final step is to share the recruitment insights with the teams. Recruiters just have to share the link with the stakeholders. With the link, they will be able to view the recruitment insights whenever they want.

Turn Recruitment Data Into Actionable Insights
Recruitment is becoming more data-oriented, but collecting data is not enough. The real benefit lies in the way the information is presented to stakeholders.
AI website builders help recruiters present their complex recruitment metrics in the form of visualizations and reports.
The representation of data in visuals and dashboards helps recruiters understand the hiring performance better, find the issues in the system, and help make proper decisions.
If you too wish to present your recruitment metrics more clearly, you should try CodeDesign.ai’s AI website builder. Explore it for free and turn your recruitment data into clear and interactive reports.